Kansas Statistical Abstract 56th edition features timely and relevant information for Kansas researchers and residents
LAWRENCE — The newest edition of the Kansas Statistical Abstract is now available on the Institute for Policy & Social Research website. This rich resource contains information on the Sunflower State on a variety of topics ranging from agriculture to transportation.
“Communities can be overwhelmed with data from federal, state and private sources. Often it is difficult to locate reliable data needed for grant applications and local decision-making. The KSA aims to relieve this burden by offering a comprehensive data resource for Kansas communities,” said Xan Wedel, senior research data engineer at IPSR.
Ahead of the November 2022 elections, this edition includes maps of the new U.S. congressional districts as well as Kansas Senate, House and State Board of Education districts. The KSA also publishes information about government and political engagement, including a map of voter participation rates in the U.S. by state in November 2020. One table shows voter registration and party affiliation by county in Kansas as of Nov. 1, 2021.
“The Kansas Statistical Abstract is a valuable resource for observing trends in Kansas agriculture, government and economic growth,” said Donna Ginther, director of IPSR. “I share the abstract with thought leaders to inform their understanding of the state.”
The KSA includes several maps and tables that describe the population landscape in Kansas. A map displaying population of Kansas by region shows how East Central Kansas, which includes Johnson County, has grown 0.26% over the last year, while all other regions of Kansas have lost population. This map also shows that nearly 2 in 3 Kansans live in the eastern third of the state. A map showing population density in Kansas by county adds more detail: Johnson and Wyandotte counties hold more than 1,000 people per square mile, while Greeley and Wallace counties in western Kansas contain fewer than 2 people per square mile.
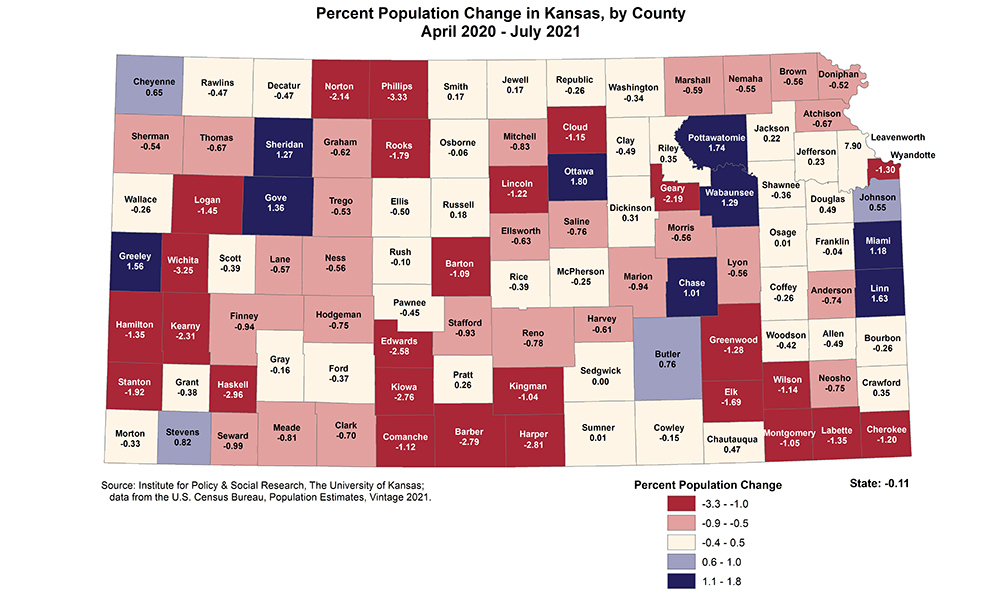
“The 2020 Census showed dramatic changes in the Kansas population. The KSA reports Census data at the local level to show how Kansas population has shifted and changed over time,” Ginther said. One map shows how population within each Kansas county changed from 2020 to 2021.
The Kansas Statistical Abstract includes data in 16 categories published over 17 chapters: Sunflower State Summary; Agriculture; Banking and Finance; Business, Industry, and Exports; Climate; Communications and Information; Courts, Crime, and Public Safety; Education; Employment and Earnings; Energy and Natural Resources; Government; Housing and Construction; Income; Parks and Recreation; Population; Transportation; and Vital Statistics and Health.
Published fully online and at no cost for users, the KSA contains the latest available state, county and local data for Kansas on topics ranging from education to business and manufacturing. Users can access the document as a single PDF or download tables, maps and graphs as separate files.