New Kansas Statistical Abstract offers insights on state population, life expectancy rates and more
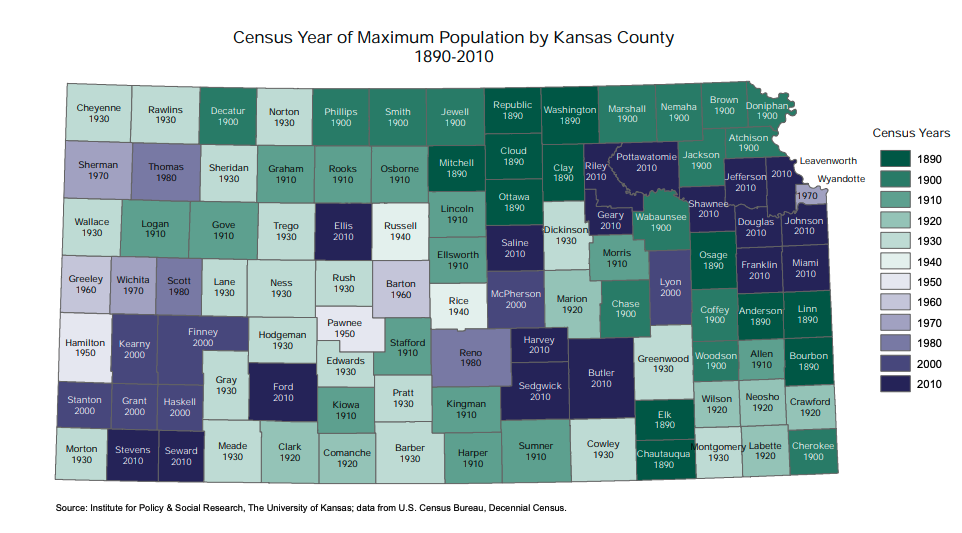
LAWRENCE — Sixty-eight of 105 counties in Kansas peaked in population before the Dust Bowl. The most recent Kansas Statistical Abstract includes this and other interesting facts about Kansas.
The Institute for Policy & Social Research at the University of Kansas recently published the 53rd Edition of the Kansas Statistical Abstract, which contains social and economic data broken down by state, county and city.
“It is important for business and community leaders as well as policymakers to understand the changing demographic, social and economic characteristics of Kansas,” said Genna Hurd, IPSR associate researcher and KSA editor. “The KSA covers data on Kansas from climate to crime, parks to population, and energy to employment. We are honored that IPSR and KU have been able to provide this service to the people of the state for more than 50 years.”
This year’s KSA presents several new data visualizations.
“Our maps and graphs bring the data to life to illustrate patterns across the state,” said Xanthippe Wedel, IPSR senior research data engineer and State Data Center lead.
These visualizations reflect ongoing areas of interest for Kansans, such as a county-by-county look at the average small business loan amount at origination and a map of natural attractions and scenic byways in Kansas. And, with a presidential election coming up in 2020, one new map shows voter participation rates in the United States, by state, for the November 2016 election.
A new graph shows poverty rates by state and compares rates from 2011 to rates from 2017. The Kansas poverty rate increased to 14.7 percent in 2017, putting Kansas in the top 10 among states for the highest poverty rate.
More sobering data includes a map of infant mortality rates in Kansas by county and life expectancy at birth in Kansas by county. According to the data behind the life expectancy map, young children in Johnson County have a life expectancy that is nearly 8 years longer than their peers in Comanche County.
Each year, the KSA is compiled from state and federal data sources ranging from the Kansas Board of Regents to the Census Bureau. The KSA available at no cost from the IPSR website.
“Working on the KSA has been an incredible and unique experience. I am lucky to be involved in research and data collection at IPSR, and I think the KSA showcases how useful this research can be on a local, state and national level,” said Abigail Byrd, IPSR student research assistant and KU 2019 Student Employee of the Year.